A Structured Approach to Finding Hidden Product Cost Savings
Apr 06, 2026
The Challenge
If you were to ask a product team where their most significant cost reduction opportunities exist, the answers would often lack specificity. Many teams can point broadly to expensive materials or high manufacturing costs, but far fewer can identify exactly which components should be targeted, explain why those components matter, and define what actions should be taken to reduce cost. This gap between general awareness and actionable insight is one of the most persistent challenges in product cost management. It is not that opportunities are absent. In fact, they are almost always present. The challenge is that they are buried within complexity, hidden across dozens or even hundreds of components, and masked by the way cost is typically evaluated.
Modern products are inherently complex systems. Each component contributes to overall performance, but also carries its own cost drivers, including material selection, geometry, tolerances, manufacturing processes, and supplier relationships. When viewed collectively, these factors create a level of complexity that can obscure meaningful patterns. Without a structured method for analyzing this complexity, teams often default to inefficient approaches. Some do very little because the problem appears too large to tackle. Others focus on components that are easy to access or familiar, even if they offer minimal impact. Still others attempt to analyze everything in detail, only to find that their efforts are diluted and their results limited.
The Constraint
This challenge is further compounded by the reality of limited resources. Engineering teams do not have unlimited time, and organizations cannot pursue every potential idea. This constraint makes prioritization essential. The question is not simply where cost exists, but where effort should be applied to generate the greatest return. Without a clear answer to this question, cost reduction initiatives can become unfocused and ineffective, consuming resources without delivering meaningful savings.
In many cases, teams gravitate toward opportunities intuitively rather than selecting those that will have the greatest impact. Alternatively, they attempt to review every component, which leads to analysis fatigue and missed opportunities. The result is a misalignment between effort and outcome, where significant time is invested but the financial impact remains limited. To address this, a structured approach is required—one that enables teams to quickly identify where to focus and how to act.
A Structured Approach
A more effective approach is to adopt a structured, data-driven method that transforms complexity into clarity. One such method consists of five steps and is guided by three key principles: information, indicators, and insight. Information provides the foundation by capturing relevant data for each component. Indicators convert that data into meaningful comparisons. Insight allows teams to interpret those comparisons and take action. When applied systematically, this approach enables teams to focus their efforts on the components and opportunities that matter most.
To illustrate how it works, we can examine a choke valve example, where each step reveals progressively deeper insight into the product’s cost structure.
Step 1: Building the Dataset
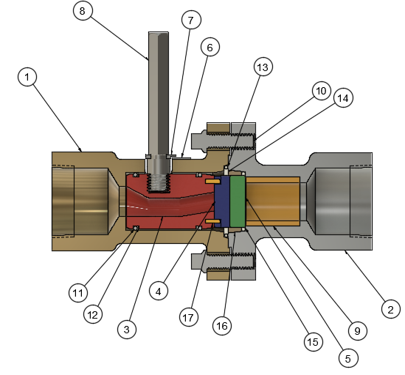
Figure 1: Cross-section of a Choke Valve
The first step in this method is to collect comprehensive information for all components within the product. At a minimum, this includes part number, description, cost, weight, and material. These parameters are essential because they provide both context and comparability. Additional parameters, such as surface area or process-specific attributes, may also be included depending on the product and industry. The goal is to consolidate this information into a single dataset that can be analyzed effectively.
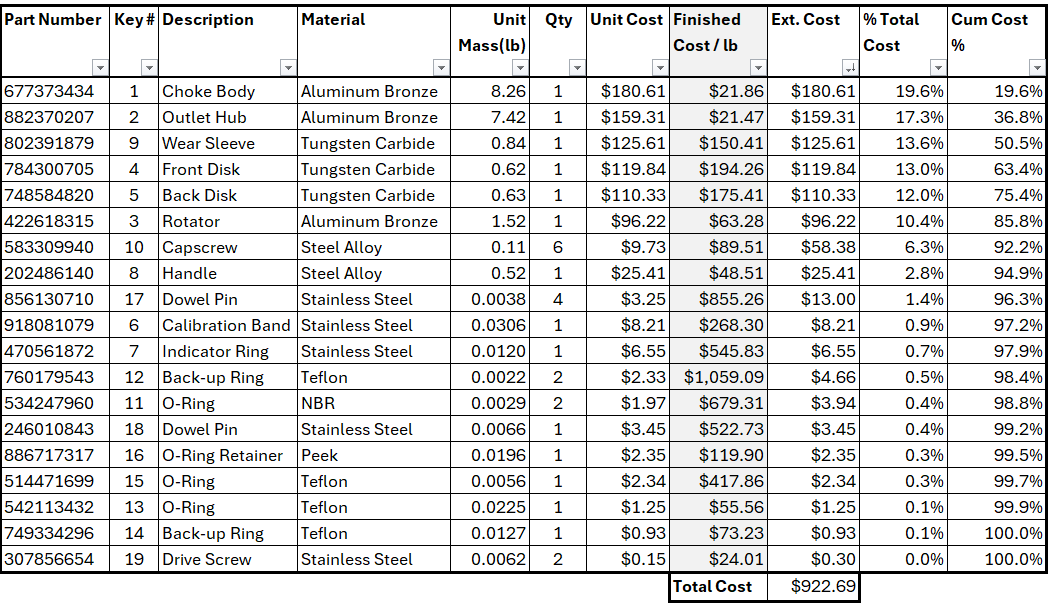
Figure 2: Choke Valve Breakdown
In the choke valve example shown in Figures 1 and 2, this step is represented by a structured dataset that includes fewer than 20 components. The same approach can, however, easily be extended to products with 1,000 or more components. In the example the total cost of the assembly is approximately $922, and the highest-cost component contributes about $180, or roughly 19.6% of the total. Even at this stage, it becomes clear that cost is not evenly distributed. A small number of components already appears to dominate the overall cost structure, setting the stage for more focused analysis.
Step 2: Prioritizing with the 80/20 Rule (Pareto Principle)
Once the data has been assembled, the second step is to apply the Pareto principle to prioritize the analysis. By sorting components from highest to lowest cost and calculating cumulative percentages, it becomes possible to identify the relatively small number of components that account for the majority of the total cost.
In the choke valve example, illustrated in Figures 1 and 2, the cumulative cost reaches approximately 75% after the top five components and about 86% after the top six. Given the relatively small dataset, it is practical to include the top six components in the analysis. This subset captures the majority of the cost while remaining manageable in scope. This step is critical because it eliminates unnecessary work. Rather than analyzing all components equally, the focus is directed toward those that will have the greatest impact on total cost.
Step 3: Revealing Patterns
With the high-cost components identified, the third step is to apply indicators that reveal underlying cost patterns. One of the most effective indicators is the cost-to-weight ratio, which normalizes cost and allows for meaningful comparisons across components.
In Figure 2, this ratio is applied to aluminum bronze components within the choke valve assembly. The choke body and outlet hub exhibit cost-to-weight ratios of approximately $21/lb, while the rotator shows a significantly higher ratio of approximately $63/lb. This represents a threefold increase compared to similar components, immediately signaling that something is different. Such a discrepancy suggests that the rotator may involve additional processing complexity, tighter tolerances, or inefficiencies that are not present in the other components. If these factors cannot be justified by functional requirements, the rotator becomes a strong candidate for cost reduction.
A similar pattern emerges when examining tungsten carbide components. The wear sleeve has a cost-to-weight ratio of approximately $150/lb, while the front and rear disks exhibit even higher ratios. Notably, the front and rear disks, which are nearly identical in function, differ in cost by approximately $20/lb. This inconsistency indicates that there may be inefficiencies or inconsistencies in manufacturing or sourcing. These observations highlight specific components that warrant deeper investigation and provide a clear direction for cost reduction efforts.
Step 4: Isolating Processing Cost from Material Cost
While the cost-to-weight ratio is highly effective, it can sometimes be influenced heavily by raw material costs. When this occurs, it becomes difficult to distinguish between cost driven by material and cost driven by processing. The fourth step addresses this by separating material cost from the overall cost and recalculating a modified ratio.
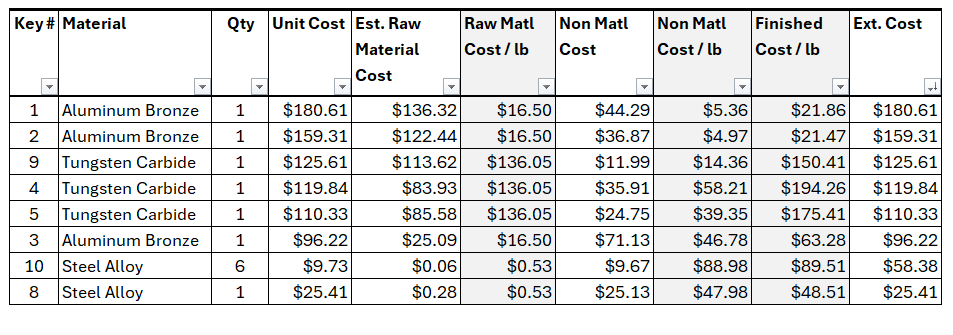
Figure 3: Isolating Material Cost from Cost-to-weight ratio
In the choke valve example shown in Figure 3, the raw material cost for aluminum bronze is $16.50/lb, while tungsten carbide is approximately $136/lb. These values explain a significant portion of the observed cost differences. However, when the material cost is removed, a clearer picture emerges. The wear sleeve shows a processing-related cost of approximately $15/lb above material cost, while the front and rear disks exhibit significantly higher processing costs, ranging from approximately $40 to $60/lb above material cost. This refined analysis confirms that the disks are not just expensive due to material, but also due to differences that may be addressed through design or manufacturing changes.
Step 5: Capturing Quick Wins for Immediate Impact
The fifth and final step is to identify quick wins. While high-cost components offer the largest potential savings, quick wins provide immediate results with minimal effort. To identify these opportunities, the analysis is expanded to include a broader portion of the product, typically up to 95% of the total cost.
In the choke valve example, illustrated in Figures 1 and 2, 95% would include components such as cap screws and the handle. Within this group, a cap screw is identified with a relatively high cost-to-weight ratio which is greater than that of aluminum bronze components and a unit cost of $9.73. Further investigation reveals that this component is being custom-manufactured, even though a standard alternative is available. By switching to a standard off-the-shelf component, the cost is reduced to $1.12 per unit, resulting in a savings of over $8 per unit. This is a clear example of a quick win—an opportunity that can be implemented rapidly and deliver immediate financial benefit.
From Complexity to Clarity
The integration of the choke valve example across all five steps demonstrates how a structured approach can transform complexity into clarity. Each step builds on the previous one, creating a logical progression from data collection to actionable insight. The numerical details provide concrete evidence of how cost is distributed, how discrepancies can be identified, and how opportunities can be prioritized.
Rather than relying on intuition or attempting to analyze everything, this method provides a focused and efficient path to cost reduction. It ensures that effort is aligned with impact and that opportunities are evaluated based on data rather than assumptions.
Focus Drives Results
Effective cost reduction is not about doing more work. It is about focusing effort where it matters most. By applying a structured approach based on information, indicators, and insight, teams can move from uncertainty to clarity. This shift enables more targeted analysis, more informed decision-making, and more impactful results.
Hidden cost savings are not rare—they are simply obscured by complexity. When that complexity is broken down and analyzed systematically, those opportunities become visible, actionable, and measurable.
Are your cost reduction efforts focused on the components that actually matter—or just the ones that are easiest to work on?